I have had a lot of enquiries recently asking about our T24LOG100 software and how it can work for them, so thought this a good opportunity to discuss the main aspects of this incredibly smart piece of monitoring technology developed in-house by Matt Nicholas our IT and Software Guru.
The latest version of our T24LOG100 instrumentation monitoring software includes advanced features such as a graphical / mapping capability and a facility for remote viewing via a web server.
Mapping
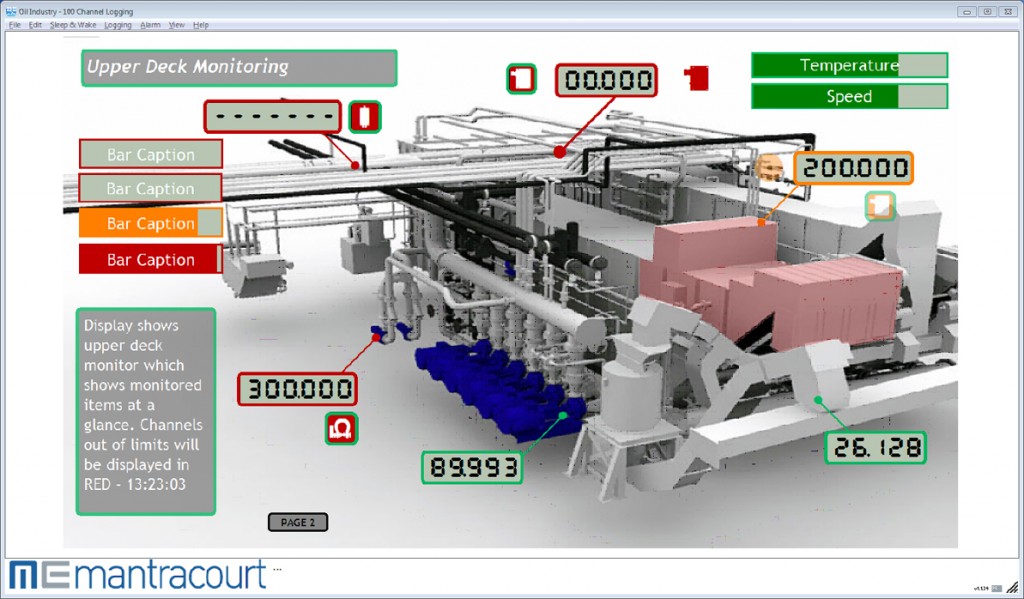
A variety of image formats including PDF, JPEG and DXF can be imported to incorporate into your project. This innovative application facilitates a real-time monitoring system with simultaneous displays of load cell data presented as graphics on a visual representation of the structure on which the sensors are located.
This display features “drag and drop” placement of customizable readouts, warnings and user definable “buttons” to toggle between pages, reset alarms etc. The use of a graphics background for the application offers a system which has the advantage of allowing a more intuitive and accurate response to the management of multiple and interacting loads.
Up to eight pages can be defined and you can switch between pages. Clicking displayed values, which can be in the form of digital display or bars, takes you back to the ‘zoomed in’ view so you can quickly investigate values.
Web Server
The T24LOG100 software now has a built in web server to provide a summary view page to other computers, tablets, iPads and smartphones etc using a standard browser. This summary page shows all channels and error and alarm status.
The new web server facility enables users to view the data online wherever they have access to their network. Users now have the freedom to monitor sensors and installations when on the move and on-site.
The built in web server also allows you to add your own custom web pages.
T24LOG100
T24LOG100 software is a data logging package that can handle up to 100 channels of wireless instrumentation data simultaneously whilst also offering a range of sophisticated features that will enable users to optimise system monitoring.
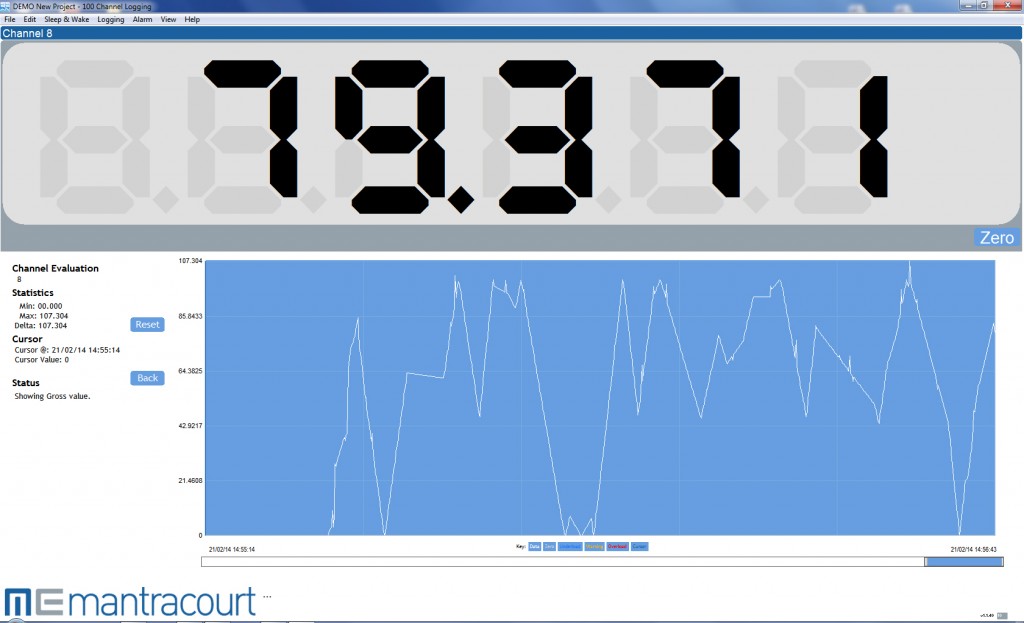
You can ‘zoom in’ on individual display channels to view detailed information on that channel along with 10,000 points of historic data.
The T24LOG100 display is customisable and it can be branded with company colours and logo and licenced for distribution.
Certain versions also come with the option of royalty free distribution to your customers.
If you have any questions please do not hesitate to contact me.
By Dave Porter, Technical Sales at Mantracourt
technical@mantracourt.com
Tel: +44 (0)1395 232020


