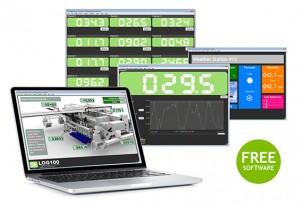
The T24 data logging software and data mapping software is now available to download free of charge. Tom Lilly, Technical Support Operator at Mantracourt, talks us through this intuitive application…
The full functionality of T24LOG100 is now available to anyone that wants it at no cost. It means that people can have a proper experiment with an important part of a system without any expenditure. This should allow people to discover how useful and easy the T24 system is. You don’t even need a base station to have a look through and change the sample projects. The tooltip help and main help files are really useful for getting to know the software.
 All the functionality is there. We have up to 100 channels of display and data logging, trend charts, mapping functions allowing intuitive visual displays, report generation and web server function for viewing on multiple platforms all over the world!
What do we mean by 100 channels? Well, these channels can either be T24 transmitter modules or mathematical functions based on the transmitters and/or other display channels. Each channel has the option of setting a peak or valley hold or varying filtration levels. All display channels can also have warning, underload and overload levels set.
All the display channels can be logged to a csv file. This can be triggered manually or automatically at intervals and opened in spreadsheet software such as MS Excel.
Double clicking on any of the display channels shows detail about that channel including a trend chart with up to 10,000 data points.
The mapping function gives the possibility of creating intuitive displays needing very little explanation. Image files such as JPEG, PDF and DXF can be imported and other objects such as status icons, level indicators and displays can be placed on the page. With some clever thought, items can  be made opaque at certain levels and clear at others allowing the images to change as the load state changes. Up to eight pages of display mapping can be used. As previously mentioned, the example project has some useful demonstrations.
Reports can be generated and saved or printed when required. These can be in various pre saved formats.
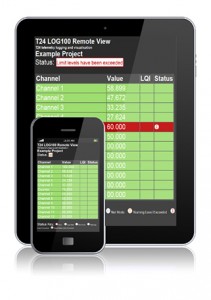
Finally, my personal favourite is the web server. With this we can see a simplified version of the main display page in a web browser. This then means that if we know the IP address and password we can view this info on any computer, tablet or smartphone connected to the same network as the host computer. It is also possible that we can dial in from anywhere in the world to see the displayed data.
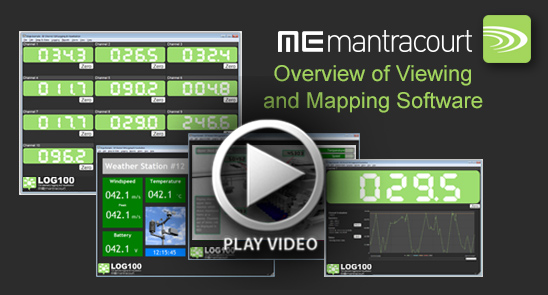
As well as the demo projects with the data logging software we now also have the first in a series of demonstration videos on LOG100. This can be found on the Mantracourt YouTube channel – click here to view.
By Tom Lilly, Technical Support Operator at Mantracourt

